EPC from operational data: where estimation ends and decision begins
The EPC Energy Label Approximation project shows that even without a lengthy manual process, it is possible to obtain a useful first estimate of a flat’s energy performance from operational data. The aim is not to replace the official energy performance certificate, but to offer a fast, understandable and data-driven view of how the property is likely to perform.
How the application looks in practice
The first demo shows part of the workflow where the user enters the basic parameters of the apartment, the indoor temperature regime and the type of heating. This is where it becomes clear how important it is to combine technical correctness with simple operation, so that the input to the model is understandable even for the average user.
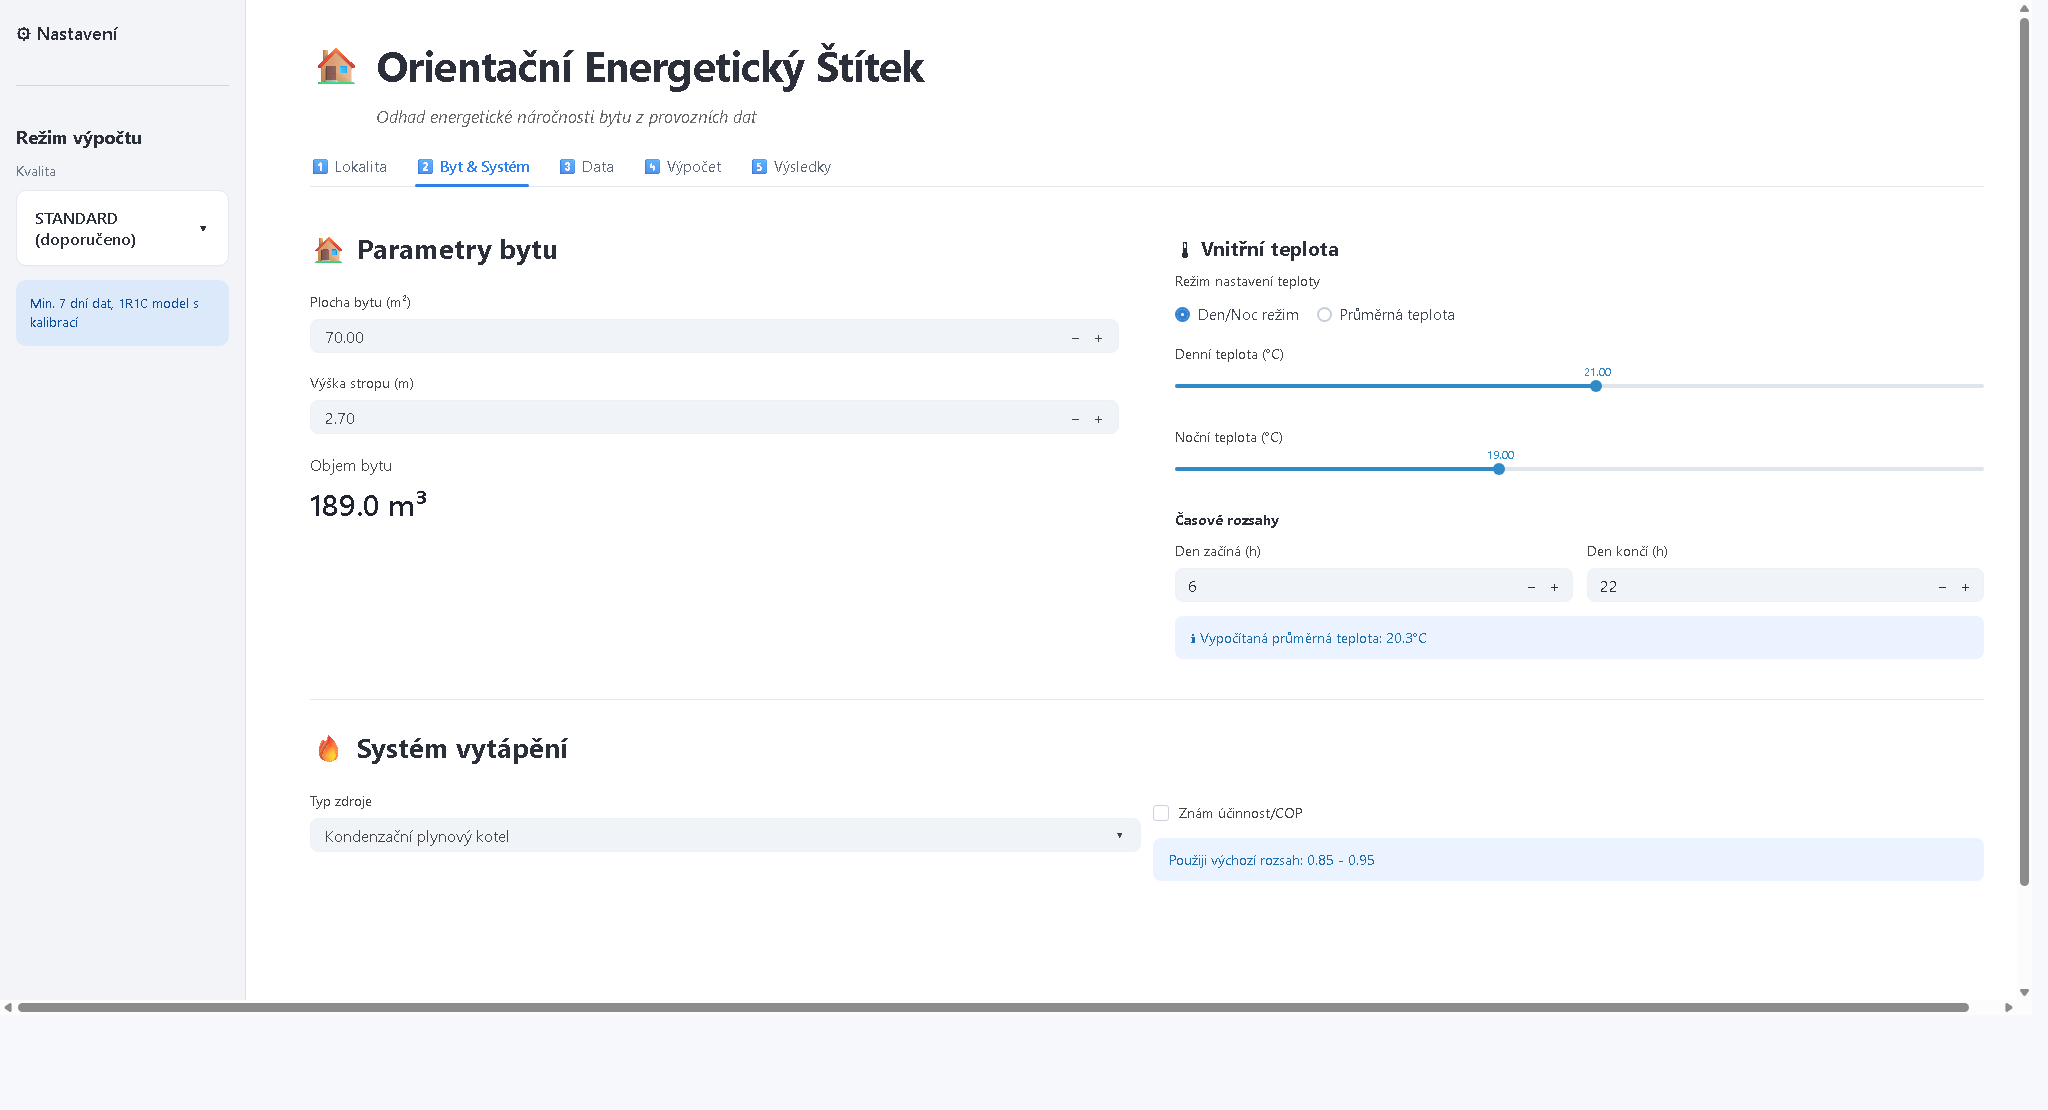
Example of the input form for apartment parameters, temperature profile and heating system.
The second demo focuses on the data layer: uploading a CSV with consumption data, selecting non-heating months and approximating water heating. This is an important point where simple operational data starts to become the basis for a qualified estimate.
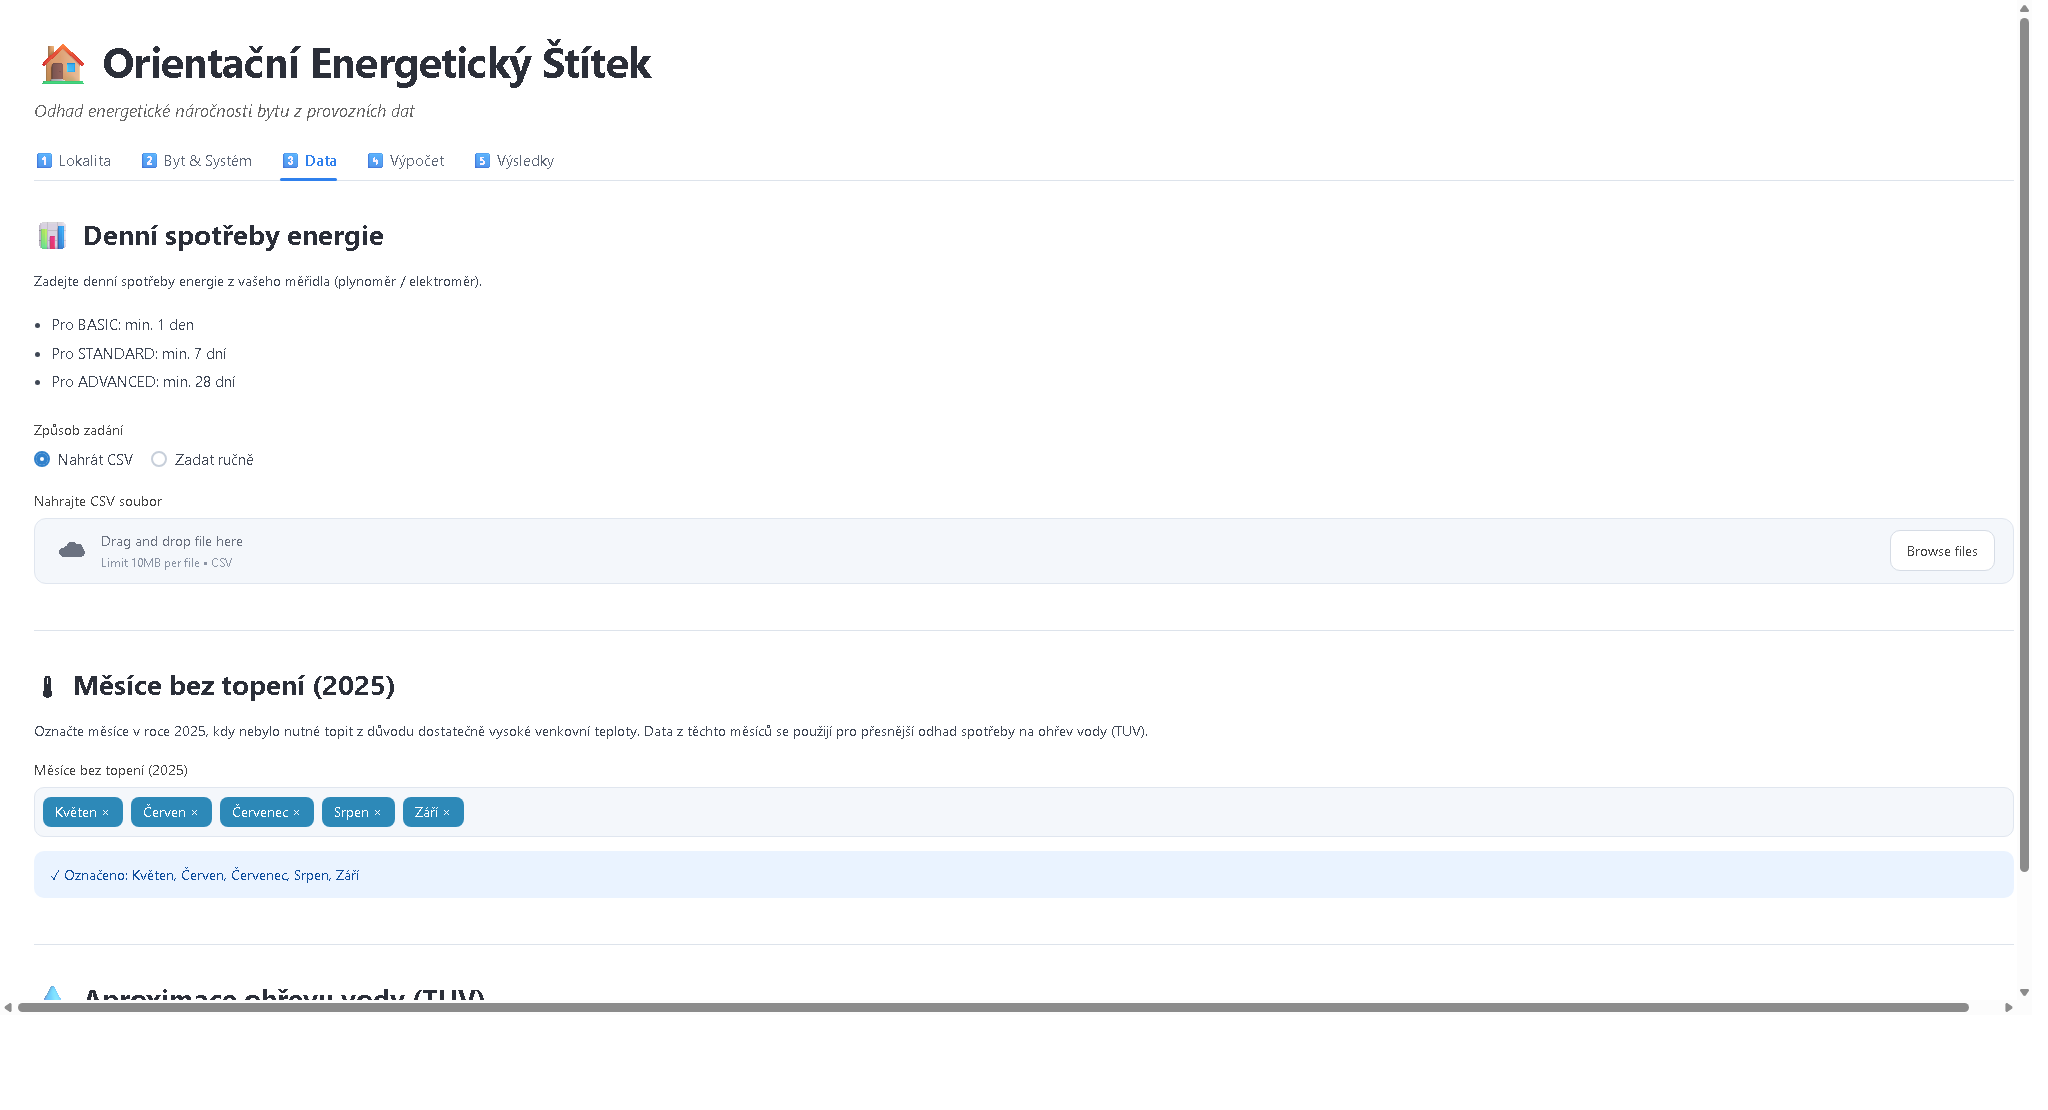
Example of the data part of the application: consumption, non-heating months and DHW model approximation.
What the project solves
In practice, the same problem often arises: you have energy consumption, the basic parameters of your apartment and you want to get your bearings quickly.
- Is the consumption reasonable or is it already suspiciously high?
- Does it make sense to invest in insulation, window replacement or a change of heating source?
- How to distinguish an expensive renovation with little impact from an intervention that really helps?
This is where an indicative calculation makes sense. Instead of waiting for the whole formal process, the user can get the first data signal for further decision making in a short while.
Added value for the user
For the owner or tenant of an apartment
- faster orientation as to whether the consumption corresponds to the size and type of the apartment,
- a better basis for decisions on savings and renovation,
- a more comprehensible explanation of why the energy bill looks the way it does.
For the buyer or investor
- a quick screening of the property before deeper due diligence,
- a better estimate of future running costs,
- an additional argument when negotiating the price or the scope of the investment.
For a consultant, developer or portfolio manager
- the ability to prioritise which flats or units to deal with first,
- clearer communication with the customer,
- the basis for productising a service that combines a technical estimate with a business recommendation.
Business value in one sentence
The main benefit of the project is that it turns unclear operational data into a quickly usable basis for decision-making. This is a value in itself: less guesswork, fewer blind investments and a faster path from question to action.
How it works for laymen
Simply put, the application does five things:
- It takes basic information about the apartment, heating and energy consumption.
- It supplements it with meteorological data for the given locality.
- It estimates what part of the consumption is related to heating and what to normal operation.
- It uses a thermal model to simulate how the apartment behaves during the year.
- It translates the result into an indicative energy class and adds a comment on reliability.
So the user gets not just a number, but also a framework for interpreting the result.
A short summary for the slightly advanced
From a software engineering and data science perspective, the project is interesting in that it combines several layers that are often separate:
- input validation and UX layer: the form guides the user towards consistent inputs and reduces errors,
- data layer: historical weather is combined with operational data and fallback mechanisms,
- domain model: the core is based on a simplified RC model of the thermal behaviour of the building,
- calibration and simulation: the model adapts to the observed consumption and then estimates the annual profile,
- reporting: the output is not just a technical calculation, but an interpretation for decision-making,
- deployment: the public application runs separately on its own subdomain, so it is easily shareable and ready for further iterations.
In practical terms, this means that the project is not just a one-off script. It is a small product: it has a data model, application logic, a user interface and a deployment.
Why this approach is interesting
Similar projects show well that data science is not just about training models. It is often more important to:
- formulate the problem correctly,
- choose a reasonably simple model,
- be able to explain the result to a person who does not need to know the mathematical details,
- and deliver a solution in a form that can actually be used.
In other words, a useful project is created where domain knowledge, data work and quality implementation come together.
Important limitation
The output of the application is an indicative estimate, not an officially certified EPC. For legal or formal purposes, a standard professional processing is still required. However, for a preliminary analysis, business discussion and prioritisation of further steps, such a tool can have very good added value.
What to take away from this
The PENB project shows that even a relatively compact application can have a real practical impact if it:
- solves a specific problem,
- returns a clear output,
- and is deployed in such a way that it is immediately usable.
If you are interested in how to use a similar principle in your product, service or internal decision making, the application is publicly available here:
Napsat komentář